Optical Spectrum
2023-12-11
The spectrum (or radiation spectrum) of a light source or some light beam contains information about the distribution of energy and power in different wavelengths. It is usually expressed in the form of a graph, giving a curve of the power spectral density versus wavelength or optical power. Figure 1 is an example, showing the numerical simulation spectrum of a supercontinuum light source. The spectrum of a single-frequency laser is different from the broad spectrum in the figure. It is characterized by very narrow lines. In the extreme case, the line width is only on the order of 1Hz, and the corresponding wavelength range is only about ≈ 3·10−12 nm (the center wavelength is 1 micron). Other lasers contain multiple lines, some with very large bandwidths (especially ultrashort-pulse mode-locked lasers), on the order of 100 nm, and frequency comb structures.
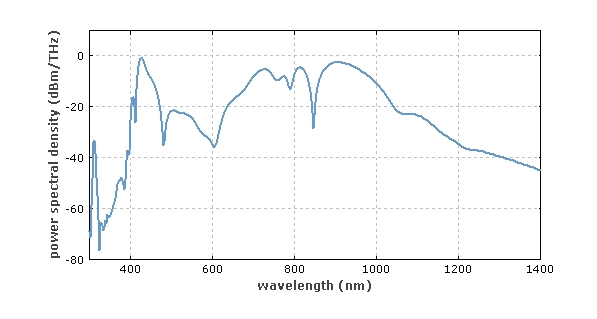
Figure 1: Numerical simulation of supercontinuum light source. See the entry Supercontinuous Generation for more details.
Different types of spectrometers can be used to receive spectra, and their applicable spectral ranges and spectral resolutions are different.
Spectrum is closely related to the temporal coherence properties of light. For example, the spectrum can be obtained from the temporal coherence equation. The spectrum is also related to the Fourier change of the electric field, but the latter cannot be obtained directly in most cases. Therefore, it is also called the Fourier spectrum of the light field.