Instantaneous Frequency
2024-1-15
Definition:
The differential of the oscillation phase with time divided by 2π.
When describing non-monochromatic signals, instantaneous frequency needs to be used, and its definition is:

That is, the differential of the oscillation phase φ with respect to time. (Removing the factor 1/2π gives you the instantaneous angular frequency.) Unlike the Fourier frequency, the instantaneous frequency is usually time-dependent. The instantaneous frequency of a sinusoidal signal is constant equal to the frequency of oscillation.
The differential of the oscillation phase with time divided by 2π.
When describing non-monochromatic signals, instantaneous frequency needs to be used, and its definition is:
That is, the differential of the oscillation phase φ with respect to time. (Removing the factor 1/2π gives you the instantaneous angular frequency.) Unlike the Fourier frequency, the instantaneous frequency is usually time-dependent. The instantaneous frequency of a sinusoidal signal is constant equal to the frequency of oscillation.
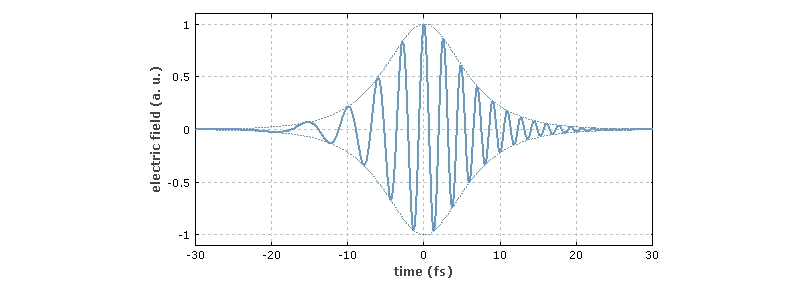
Figure 1: Electric field for a strong up-chirp pulse, where the instantaneous frequency increases with time.
The instantaneous frequency is very important when considering frequency noise and phase noise. It is also often used for chirped light pulses (Figure 1), whose instantaneous frequency is time-dependent. The basic idea is more intuitive than Fourier frequency. The same concept occurs in music: notes are represented in musical notation as time intervals, and the instantaneous frequency within each interval is a constant value (corresponding to the pitch). However, this concept becomes problematic for complex signals, such as white noise. In lasers, it is easy to define the instantaneous frequency for single-frequency lasers, but for multimode lasers, you first need to separate the different frequency components (using filtering techniques) before you can get the instantaneous frequency. The concept of instantaneous frequency is also useful in chirped light pulses, where the instantaneous frequency is different for different pulses.
The Fourier spectrum of an oscillating signal does not represent the probability distribution of the instantaneous frequency, so the linewidth measured using this spectrum is not the root mean square value of the instantaneous frequency. The relationship between Fourier frequencies in the instantaneous frequency domain is more complex and microsecond.
The change of instantaneous frequency with time can be obtained from the spectral diagram. However, just a curve of instantaneous frequency versus time does not give all the information about the changes.